When buying Google stock now? Alphabet settlement Update date: February 21, 2019 グーグル株 買い時は今? アルファベット決算 更新日:2019年2月21日
グーグル株 買い時は今? アルファベット決算 - トランプ政権と米国株投資
When buying Google stock now? Alphabet settlement
Update date: February 21, 2019
In February 2018 the "suitable temperature market" of the US stock collapsed.
After that, the stock price returned, but it fell again after October 18, and it is returning to a recovery trend in early 19.
Whether we view this as "buying time" depends on people.
Therefore, in this article, we will look at the stock price chart of the alphabet that is interesting and recent indicators.
※ Alphabet Inc. (Alphabet Inc.) is a holding company ("Google Inc." is a subsidiary of Alphabet Inc.) of search site "Google" of multiple languages · various types (letters, images, movies, maps, news, shopping etc.) In the alphabet, holders have no voting rights 【GOOG】 stock and [GOOGL] stock with voting rights. This is a measure to protect the voting rights of old shareholders including founder.
【table of contents】
Alphabet business: net advertisement and new fields
Most of the revenue is net advertising
Do you need screening for new businesses?
Overview of key indicators
Stock Price Changes (Chart and Growth Rate)
Quarterly settlement (forecast and actual price)
Expected value
Quarterly financial results (GAAP standards)
Full-year account settlement (GAAP standard)
Profit and loss calculation (sales, net profit, etc.)
EPS, operating margin etc.
Balance sheet
ROA, ROE, etc.
Cash flow
Alphabet business: net advertisement and new fields
Most of the revenue is net advertising
In the data of December 2017, 98.9% of the sales composition of the alphabet is advertisement.
And, sales by region are the following percentages.
US 47.3%
Europe, Middle East, Africa 32.5%
Asia Pacific 14.6%
North America, Central America, South America (excluding the United States) 5.5%
The Google adsense that I also post is also a source of income for Google like a drop of Okawa.
In terms of annual settlement figures, net sales declined due to increased sales, but in the first quarter of 18, sales and income increased.
After February 2018 stock price fell, but after that it went back to its original trajectory.
I have not found a rival that can destroy Google's advantage in searching yet.
Do you need screening for new businesses?
The business is good, but the new business under its holding company is "Fiber" (conducting fiber optic business in the US), "nest" (Smart Home business), "X" (new technology development), "Weimo" ( Automatic operation), venture capital, etc., and it is said that it is necessary to sort out.
This is because Google's advertisement accounts for more than 90% of sales, but sales of these new businesses are less than 1%, and about 30% of the annual capital investment is invested there .
The writer said, "Google is originally such a company," but because the eyes of the investors around the world are severe, reporters who are face-to-face in the media say "We should select more promising projects and narrow down our new business "I argue that.
However, concerns are emerging in recent years in Google, which can also be seen without enemies.
It is a response to regulations such as antitrust law.
For example, the European Commission imposed a penalty equivalent to approximately 350 billion yen to Google in June 2017 due to the allegation that the product comparison service of its company was given priority when displaying the search results.
Personal information protection was also strengthened with GDPR (EU general data protection rule) in May 18, but this is a policy that aims at Google, フ ェ イ ス ブ ッ ク, ア マ ゾ ン etc.
Because there are problems such as FB information leakage, public opinion seeking protection of personal information is strengthening in the world, so it is expected that the cost will be increased for that measure and the profit margin will decrease in the future.
Overview of key indicators
Sponsoring
First of all, let's look at the alphabet with data of key indicators.
GOOG GOOGL
19/1/2 Stock price 1016.6 1027.2
19/2/20 Stock price 1113.8 1120.6
Stock price increase rate 0.1 0.1
52 week high 1273.9 1291.4
52 week low 970.1 977.7
EPS 43.7 43.7
PER 25.5 25.6
Dividend (yield) - -
※ 300 million shares of GOOG, 3.5 billion GOOGL. The combined market capitalization of the two is $ 776.3 billion.
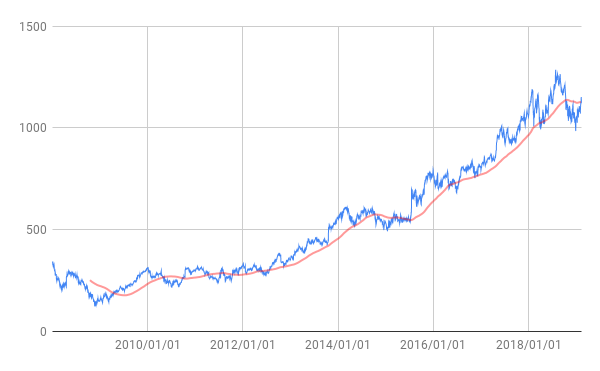
Stock Price Changes (Chart and Growth Rate)
Furthermore, we will look at the stock price of 【GOOG】 (the stock price trend of 【GOOGL】 is almost the same, so it is omitted).
The blue line is the stock price trend. The red line is the moving average line for 200 days.
Stock prices fell down in early February, after which stock prices recovered once, but after Fed chairman Powell's parliamentary testimony went down. In March, personal information leakage of フ ェ イ ス ブ ッ ク was regarded as a problem, and Google with the business model of the advertising entity concerned about the same type of risk, the stock price fell.
Although the stock price recovered after that, concerns have increased since 18 years.
Let's see its growth rate annually
★ 1: Stock price growth rate of each year (※ the closing price in 19 years is 2/20)
GOOG initial price lowest highest closing rate increase rate
グーグル株 買い時は今? アルファベット決算
更新日:
2018年2月に米国株の「適温相場」が崩壊。
その後、株価が戻りましたが、18年10月以降、再び下落し、19年初めには回復基調に戻っています。
これを「買い時」と見るかどうかは、人によって意見が分かれそうです。
そこで、この記事では、気になるアルファベットの株価チャートと最近の指標を見ていきます。
※アルファベット(Alphabet Inc.)は多言語・多種類(文字、画像、動画、地図、ニュース、ショッピング等)の検索サイト「Google」の持株会社(Google Inc.はAlphabet Inc.の子会社)。アルファベットには保有者に議決権がない【GOOG】株と議決権のある【GOOGL】株がある。これは創業者を含んだ古い株主の議決権を守るための措置。
【目次】
アルファベットの事業:ネット広告と新規分野
収益のほとんどはネット広告
2017年12月のデータで見ると、アルファベットの売上構成の98.9%は広告です。
そして、地域別売上高は以下の割合となっています。
| 米国 | 47.3% |
| 欧州・中東・アフリカ | 32.5% |
| アジア太平洋 | 14.6% |
| 北米・中米・南米(米国除く) | 5.5% |
筆者も掲載しているグーグルアドセンスも大河の一滴のようなグーグルの収入源となっているわけです。
年次決算の数字では売上増の純利益減となりましたが、18年第1四半期は増収増益でした。
2018年2月以降、株価が下がりましたが、そのあとは元の軌道に戻りました。
検索におけるグーグルの優位を崩せるほどのライバルはまだ、見当たりません。
新規事業には選別が必要?
その事業は好調ですが、その持ち株会社傘下にある新規事業は「ファイバー」(米国で光ファイバー事業を行う)、「ネスト」(スマートホーム事業)、「X」(新技術開発)、「ウェイモ」(自動運転)、ベンチャーキャピタルなど、多岐にわたり、その選別が必要ではないかとも言われています。
というのは、グーグルの広告が売上の9割以上を占めているのに、これらの新規事業の売上は1%にも満たず、そこに年間設備投資額の約3割を投じているからです。
筆者は「グーグルはもともと、そういう企業なのだろう」と割り切りますが、世の中の投資家の目は厳しいので、メディアでは訳知り顔の記者たちが「もっと有望事業を選定し、新規事業を絞り込むべきだ」などと論じています。
ただ、向かうところ敵なしにも見えるグーグルにも、近年、懸案事項が浮上してきています。
それは、独占禁止法などの規制への対応です。
例えば、欧州委員会は、検索結果の表示の際、 自社の商品比較サービスを優先させたとの嫌疑により、2017年6月にグーグルに対して約3500億円相当の制裁金を科しました。
18年5月にはGDPR(EU一般データ保護規則)で個人情報保護も強化されましたが、これはグーグルやフェイスブック、アマゾンなどを狙い撃ちにする政策です。
FB情報流出問題などもあって、個人情報保護を求める世論は世界で強まっているので、今後は、その対策のためにコストがかかり、利益率が下がる可能性が見込まれています。
主な指標を概観
スポンサーリンク
まず、主要指標のデータでアルファベットを見てみましょう。
| GOOG | GOOGL | |
| 19/1/2株価 | 1016.6 | 1027.2 |
| 19/2/20株価 | 1113.8 | 1120.6 |
| 株価上昇率 | 0.1 | 0.1 |
| 52週高値 | 1273.9 | 1291.4 |
| 52週安値 | 970.1 | 977.7 |
| EPS | 43.7 | 43.7 |
| PER | 25.5 | 25.6 |
| 配当(利回り) | - | - |
※GOOGの株式数は3億、GOOGLは3.5億。両者を合わせた時価総額は7763億ドル。
株価推移(チャートと伸び率)
さらに、【GOOG】の株価を見てみます(【GOOGL】の株価推移はほぼ同じなので省略)。
青線が株価推移。赤線が200日間の移動平均線です。
2月上旬に株価が下がり、その後に株価がひととき回復したのですが、パウエルFRB議長の議会証言の後に下落。3月にはフェイスブックの個人情報流出が問題視され、広告主体のビジネスモデルを持つグーグルに同種のリスクが懸念され、株価が下がりました。
その後、株価は回復したものの、18年以降、懸念材料が増えてきています。
年次でその伸び率を見てみましょう
| ★1:各年の株価伸び率(※19年終値は2/20) | |||||
| GOOG | 初値 | 最安 | 最高 | 終値 | 上昇率 |
| 2019 | 1016.6 | 1016.1 | 1146.0 | 1113.8 | 10% |
| 2018 | 1048.3 | 976.2 | 1268.3 | 1035.6 | -1% |
| 2017 | 778.8 | 786.1 | 1077.1 | 1046.4 | 34% |
| 2016 | 743.0 | 668.3 | 813.1 | 771.8 | 4% |
| 2015 | 527.6 | 491.2 | 776.6 | 758.9 | 44% |
| 2014 | 557.7 | 494.0 | 610.1 | 525.0 | -6% |
| 2013 | 360.0 | 351.4 | 560.4 | 560.4 | 56% |
| 2012 | 326.2 | 279.5 | 384.0 | 353.7 | 8% |
| 2011 | 298.6 | 237.4 | 323.0 | 323.0 | 8% |
| 2010 | 313.7 | 218.0 | 313.4 | 297.0 | -5% |
| 2009 | 154.0 | 141.4 | 311.4 | 310.0 | 101% |
| 2008 | 346.4 | 128.7 | 346.4 | 153.8 | -56% |
| ★2:各年初から2019/2/20までの伸び率 | |||||
| 19年~ | 18年~ | 17年~ | 16年~ | 15年~ | 14年~ |
| 10% | 6% | 43% | 50% | 111% | 100% |
| 13年~ | 12年~ | 11年~ | 10年~ | 09年~ | 08年~ |
| 209% | 241% | 273% | 255% | 623% | 222% |
近年は、EUを中心に個人情報規制の動きが本格化してきました。
欧州委員会は7月18日に、グーグルが「アンドロイド」を搭載した携帯で自社の検索サービス等を不当優遇したことをEU競争法違反と見なして約5600億円相当の制裁金の支払いを命じています。
ただ、今後、EUが採った個人情報保護の潮流が世界に広まれば、コスト増となり、今までほどの発展を維持するのは難しくなるのかもしれません。
四半期決算(予想と実値)
【18年第4四半期決算の予測と結果】
★EPS:予想10.91$→実値10.95$
★売上高:予想389.1億$→実値392.8億$
予想値
さらに、ロイターが調べた四半期決算のEPSと売上の予想を整理してみます(2019/2/1、売上単位は100万ドル)。
| 売上予想 | 平均 | 上限 | 下限 | 期間 |
| 2019 | 162998 | 167239 | 158247 | 通年 |
| 6-19 | 38985 | 39753 | 38118 | 4半期 |
| 3-19 | 37221 | 38191 | 36155 | 4半期 |
| 売上 | 予想 | 結果 | 差 | % |
| 9-18 | 34045 | 33740 | 305 | 0.89 |
| 6-18 | 32171 | 32657 | 486 | 1.51 |
| 3-18 | 30288 | 31146 | 858 | 2.83 |
| 12-17 | 31868 | 32323 | 456 | 1.43 |
| 9-17 | 27204 | 27772 | 568 | 2.09 |
| EPS予想 | 平均 | 上限 | 下限 | 期間 |
| 2019 | 46.96 | 52.73 | 43.1 | 通年 |
| 6-19 | 11.38 | 12.46 | 10.63 | 4半期 |
| 3-19 | 10.55 | 11.99 | 9.42 | 4半期 |
| EPS | 予想 | 結果 | 差 | % |
| 9-18 | 10.42 | 13.06 | 2.64 | 25.32 |
| 6-18 | 9.58 | 11.75 | 2.17 | 22.59 |
| 3-18 | 9.28 | 9.93 | 0.65 | 6.99 |
| 12-17 | 9.98 | 9.7 | 0.28 | 2.8 |
| 9-17 | 8.33 | 9.57 | 1.24 | 14.91 |
※決算予想では米国会計基準(GAAP)とは異なる「非GAAP基準」の数値が多用されています。これは各社が経営実態を踏まえて調整した数値です(売上とEPSの数値が後述のGAAP基準での数値と異なる場合は、非GAAP基準の数値)。
四半期決算(GAAP基準)
GAAP基準での四半期会計の実績は以下の通りでした。
|
売上高 |
純利益 |
EPS |
|
| 2016/03 |
20257 |
4207 |
6.02 |
| 2016/06 |
21500 |
4877 |
7 |
| 2016/09 |
22451 |
5061 |
7.25 |
| 2016/12 |
26064 |
5333 |
7.56 |
| 2017/03 |
24750 |
5426 |
7.73 |
| 2017/06 |
26010 |
3524 |
5.01 |
| 2017/09 |
27772 |
6732 |
9.57 |
| 2017/12 |
26064 |
5333 |
4.35 |
| 2018/03 |
31146 |
9401 |
13.33 |
| 2018/06 |
32657 |
3195 |
4.54 |
| 2018/09 |
33740 |
9192 |
13.06 |
通年決算(GAAP基準)
最後に、通年決算の数字を見てみます(売上、利益、資産、負債、資本、キャッシュフローなどの単位は百万ドル。EPS=希薄化後EPS)
損益計算(売上、純利益等)
|
売上高 |
営業CF |
同マージン |
純利益 |
|
| 2008/12 |
21796 |
7853 |
36.00% |
4227 |
| 2009/12 |
23651 |
9316 |
39.40% |
6520 |
| 2010/12 |
29321 |
11081 |
37.80% |
8505 |
| 2011/12 |
37905 |
14565 |
38.40% |
9737 |
| 2012/12 |
46039 |
16619 |
36.10% |
10737 |
| 2013/12 |
55519 |
18659 |
33.60% |
12733 |
| 2014/12 |
66001 |
23024 |
34.90% |
14136 |
| 2015/12 |
74989 |
26572 |
35.40% |
16348 |
| 2016/12 |
90272 |
36036 |
39.90% |
19478 |
| 2017/12 |
110855 |
37091 |
33.50% |
12662 |
※同マージン=営業キャッシュフローマージン。15~35%程度あれば優良な数値。通常、売上高>営業CF>純利益となる。営業CF<純利益となる企業は粉飾決算の可能性あり。
・・・
17年の通年決算、17年第1四半期~18年第1四半期の決算などを見ると、業績自体は一定の水準をキープしていますが、年次報告書(2017)は、わりと厳しい未来の見通しを明かしています。
そこでは「当社の収益成長率は時が経つにつれて低下する可能性があり、将来的には営業利益率の低下圧力がかかることを予想している」とも述べていました。競争の激化、オンライン広告市場の進化・多様化、ユーザーのテクノロジー、デバイス等の採用率、コスト増加等により、利益率は下押し圧力を受ける可能性があることを見込んでいるのです(コスト増の要因の中には、GDPRも挙げられていました)。
EPSや営業利益率など
|
営業利益率 |
EPS |
DSO |
|
| 2008/12 |
30.4 |
6.7 |
40.2 |
| 2009/12 |
35.2 |
10.2 |
44.9 |
| 2010/12 |
35.4 |
13.2 |
46.3 |
| 2011/12 |
31 |
14.9 |
46.6 |
| 2012/12 |
25.4 |
16.2 |
48.4 |
| 2013/12 |
23.3 |
18.8 |
51.2 |
| 2014/12 |
25 |
20.6 |
50.5 |
| 2015/12 |
25.8 |
22.8 |
51 |
| 2016/12 |
26.3 |
27.9 |
51.9 |
| 2017/12 |
26.1 |
18 |
53.5 |
| TTM |
23.8 |
26.7 |
46.6 |
バランスシート
|
総資産 |
総負債 |
株主資本 |
自己資本率 |
|
| 2008/12 |
31768 |
3529 |
28239 |
88.9% |
| 2009/12 |
40497 |
4493 |
36004 |
88.9% |
| 2010/12 |
57851 |
11610 |
46241 |
79.9% |
| 2011/12 |
72574 |
14429 |
58145 |
80.1% |
| 2012/12 |
92711 |
22073 |
71570 |
79.8% |
| 2013/12 |
109050 |
22073 |
86977 |
78.7% |
| 2014/12 |
129187 |
25327 |
103860 |
80.4% |
| 2015/12 |
147461 |
27130 |
120331 |
81.6% |
| 2016/12 |
167497 |
28461 |
139036 |
83.0% |
| 2017/12 |
197295 |
44793 |
152502 |
77.3% |
アルファベットの年次報告書の記録を見ると、8割近い驚異的な自己資本率をたたき出しています。
さらに、重要指標を見てみます。
ROAとROEなど
|
ROA |
ROE |
流動比率 |
|
| 単位 |
% |
% |
倍率 |
| 2008/12 |
14.8 |
16.6 |
8.8 |
| 2009/12 |
18.1 |
20.3 |
10.6 |
| 2010/12 |
17.3 |
20.7 |
4.2 |
| 2011/12 |
14.9 |
18.7 |
5.9 |
| 2012/12 |
12.9 |
16.5 |
4.2 |
| 2013/12 |
12.6 |
16.3 |
4.6 |
| 2014/12 |
11.9 |
15.1 |
4.8 |
| 2015/12 |
11.4 |
14.1 |
4.7 |
| 2016/12 |
12.4 |
15 |
6.3 |
| 2017/12 |
6.9 |
8.7 |
5.1 |
| TTM |
9.1 |
11.5 |
4.1 |
★ROE=当期純利益÷自己資本 ※投下資本に対して企業が上げた利益を見る
★ROA=当期純利益÷総資産 ※総資産を用いて企業が上げた利益を見る
★流動比率=流動資産÷流動負債 ※短期的な支払い能力を見る(下表では資本が負債の何倍かを表記)
キャッシュフロー
|
営業CF |
投資CF |
財務CF |
フリーCF |
|
| 2008/12 |
7853 |
-5319 |
87 |
5494 |
| 2009/12 |
9316 |
-8019 |
233 |
8506 |
| 2010/12 |
11081 |
-10680 |
3050 |
7063 |
| 2011/12 |
14565 |
-19041 |
807 |
11127 |
| 2012/12 |
16619 |
-13056 |
1229 |
13346 |
| 2013/12 |
18659 |
-13679 |
-857 |
11301 |
| 2014/12 |
23024 |
-21055 |
-2087 |
12065 |
| 2015/12 |
26572 |
-23711 |
-4225 |
16657 |
| 2016/12 |
36036 |
-31165 |
-8332 |
26064 |
| 2017/12 |
37091 |
-31401 |
-8298 |
24006 |
【スポンサードリンク】